Infographics
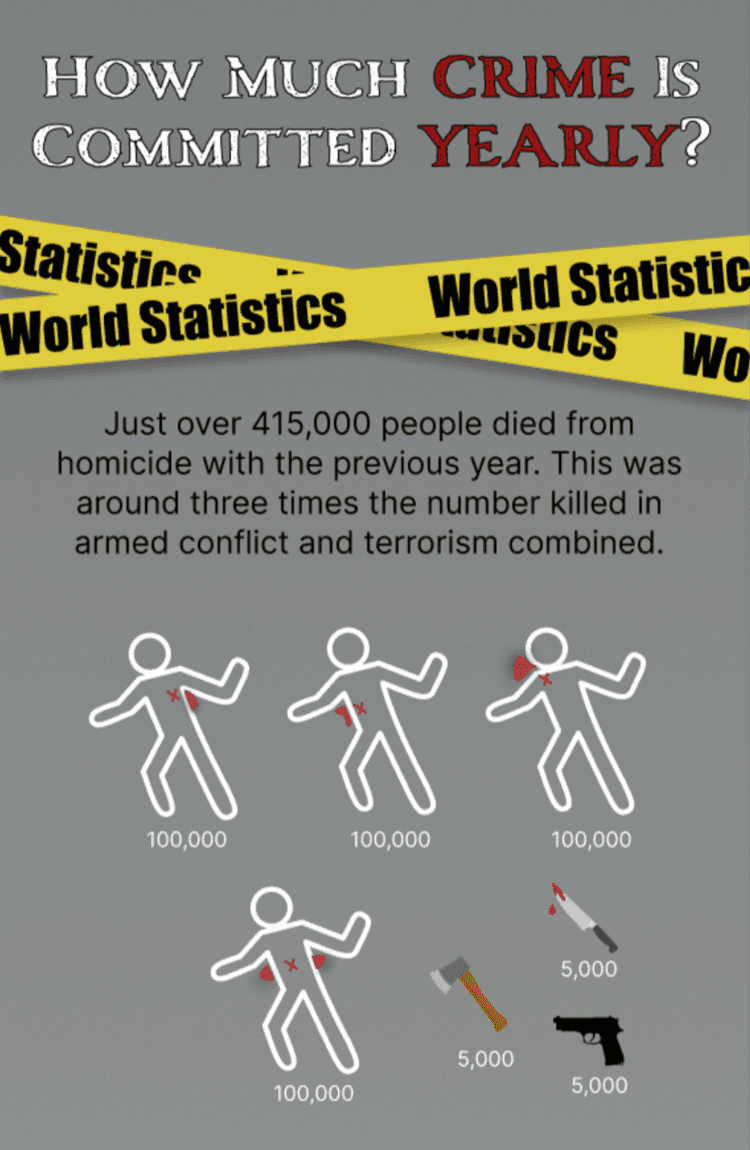
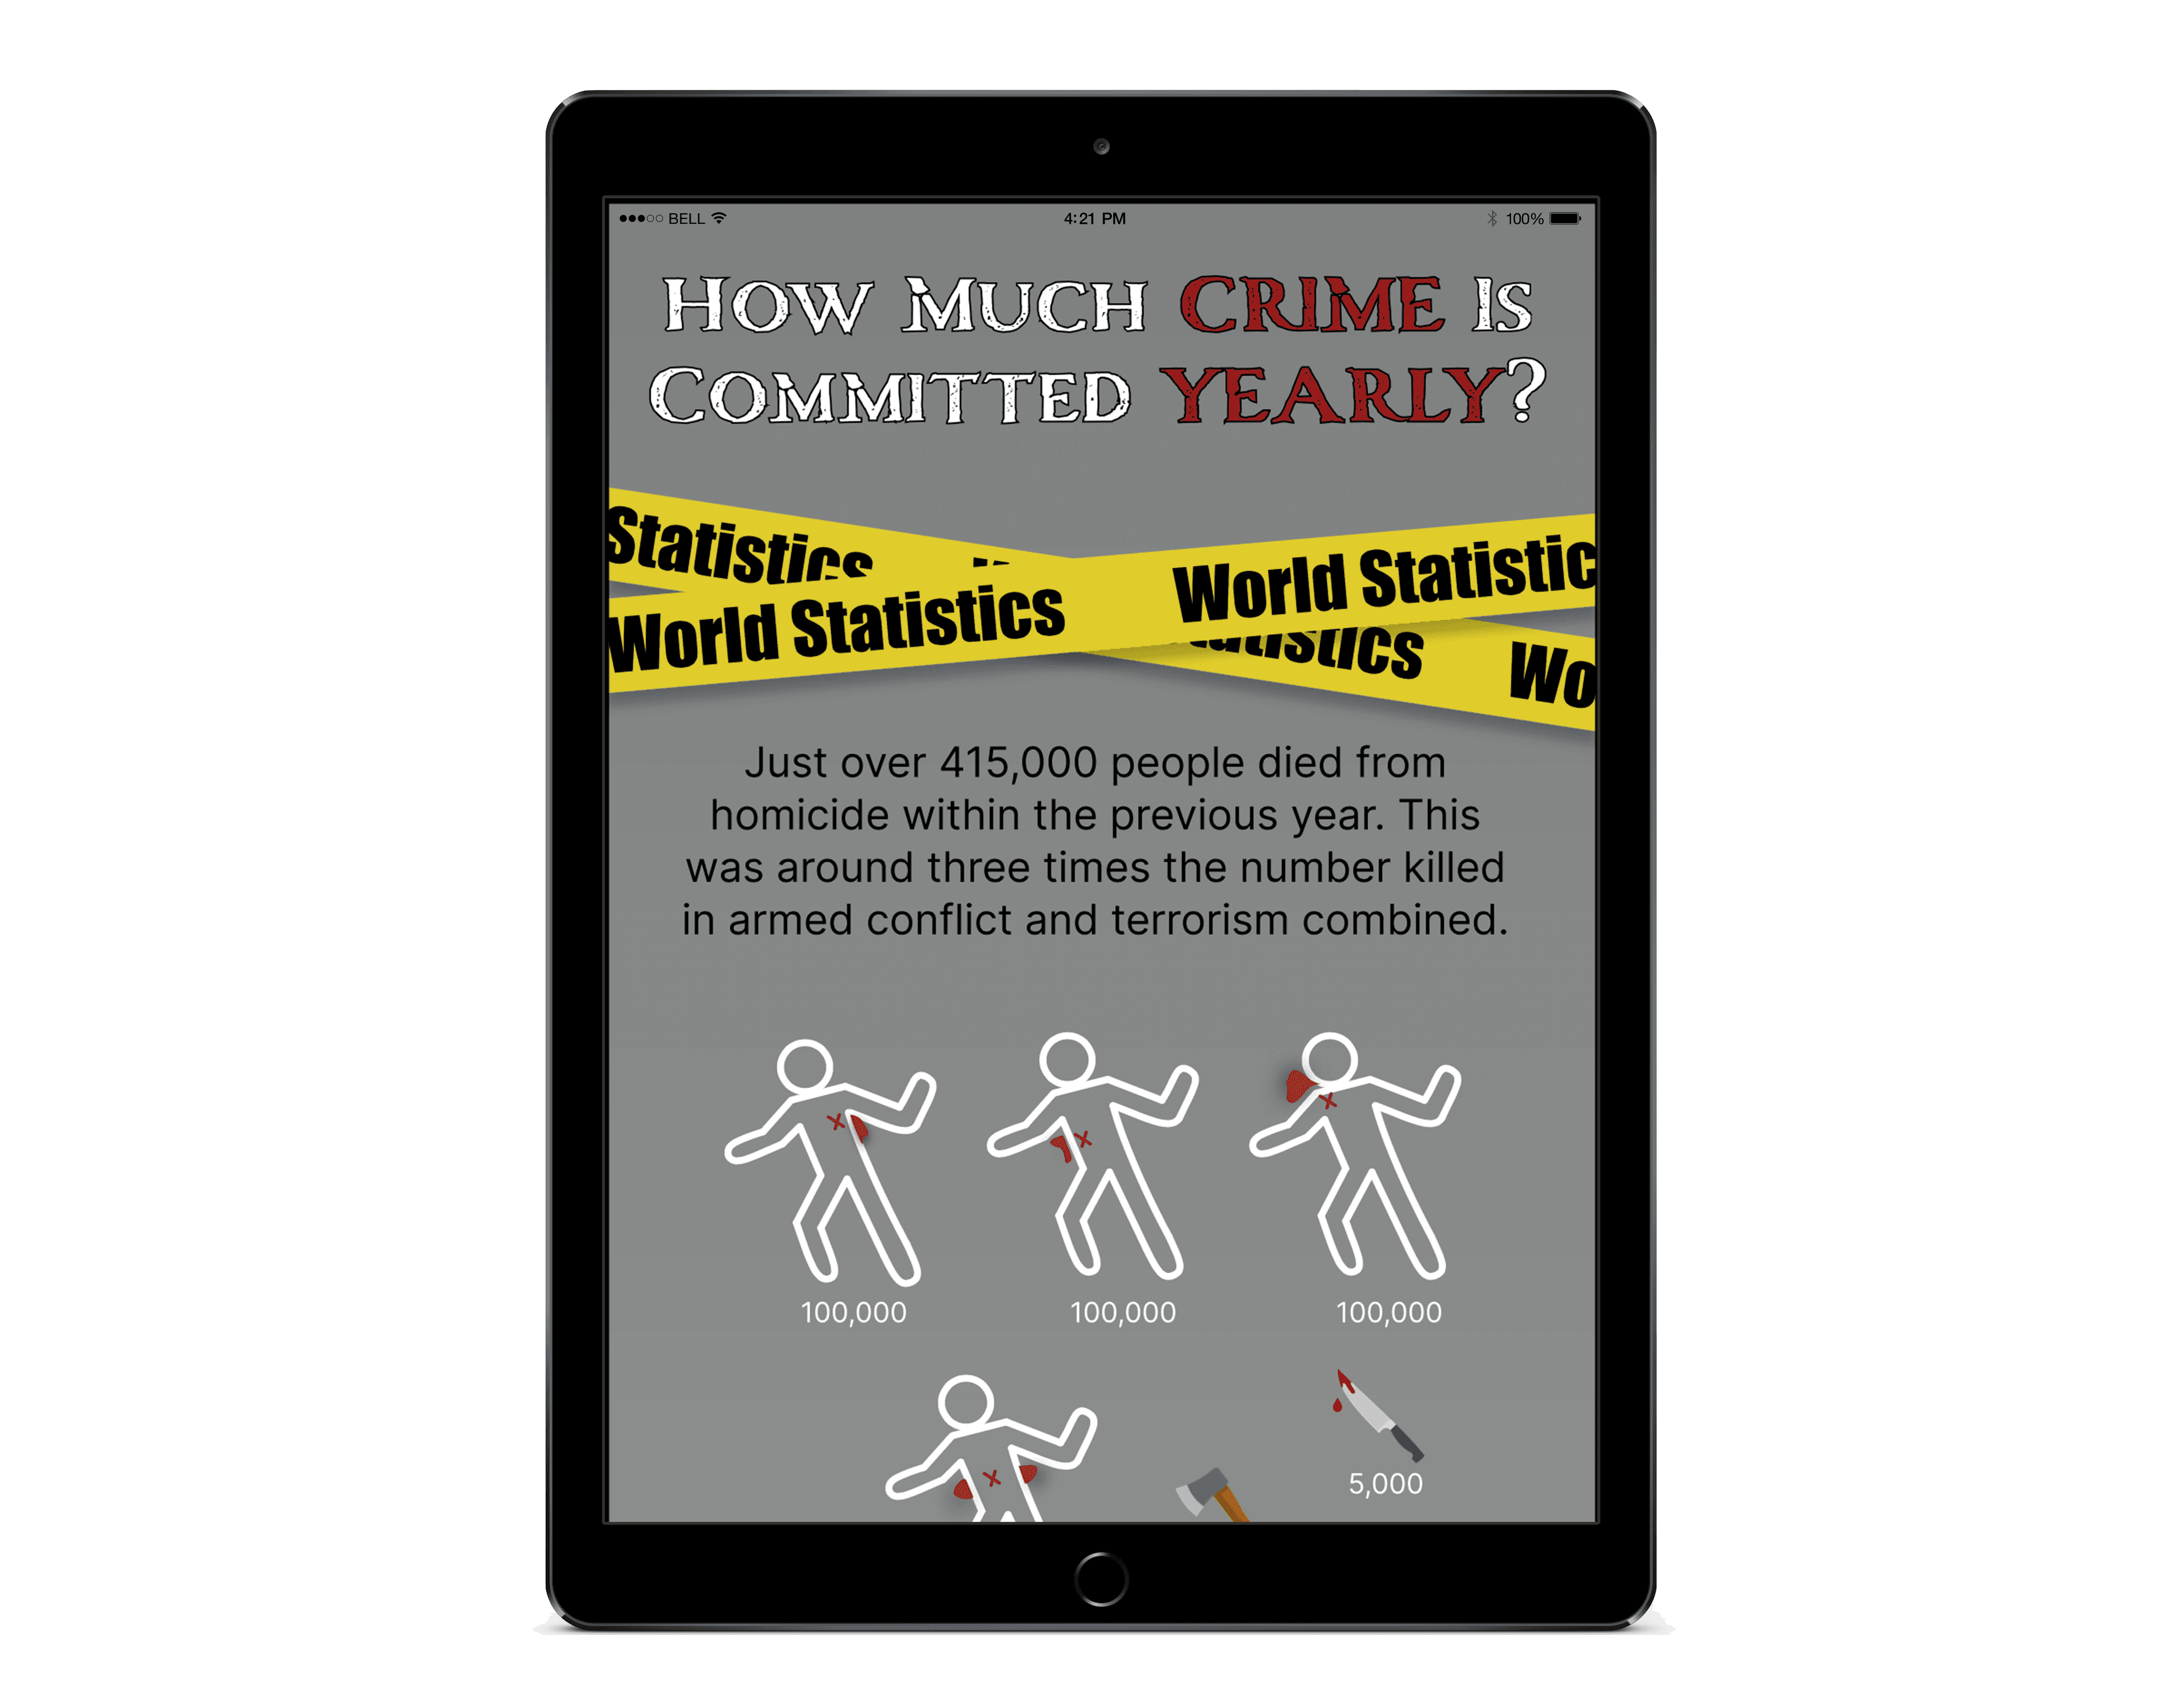
How Much Crime Is Committed Yearly?
Project Overview
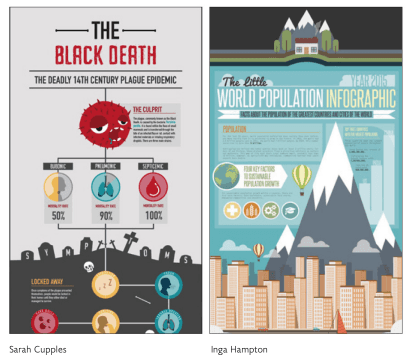
This project was our first look at image and data visual and from looking at previous examples, with the dark topics they covered while using light hearted illustrations and icons, I knew I was going to enjoy this project. We had creative freedom on what we wanted. our infographics to be on so with that we jumped right into idea generation.
Research
For research I began my coming up with ideas and questions that I wanted to base my infographics on bit. I had an idea in mine which was about crime and with some further research into I came up with my infographics question, “How much crime is committed yearly?” With my chosen question sorted I then began gathering and organising the data I was finding and going to be including within my infographics.
Sketches/Wireframes
My sketches and wireframes were focused on the icons that I was trying to create for the project and also on the layout of the project. Seeing if it flowed together well. They turned out well and so I moved onto making a lo-fi mockup of the infographic.


Lo-fi Mockups
At this point it was looking a bit worrying as I had chosen colour scheme and randomly added a blue background which didn’t fit the dark tone of the project. I was pleased at the few infographics I had created but there was only a few and it didn’t look like too much. At this point I realise creating each infographic is going to take longer than expected so I got working right away to make more.
High Resolution Poster
After some well needed improvements on my lo-fi mockups and a lot of time spent on creating it, I had created high resolution infographics which I then combined onto a poster so that you can easily read through it. Specific parts of my designs I was most pleased with where the headings that I made look like police tape and the icons I had created to represent each crime.